Video conf. notes 2 Feb. 2017 - Online biodiversity data
SWIFFT video conference notes are a summary of the video conference and not intended to be a definitive record of presentations made and issues discussed.
This video conference was supported through resources and technology provided by the Department of Environment, Land, Water and Planning, Victoria. SWIFFT wishes to thank speakers for their time and delivery of presentations. Thanks to Craig Whiteford who chaired the session from Ballarat.
The first video conference for 2017 had a theme: Online data for biodiversity
KEY POINTS SUMMARY
(Quick take home messages from this video conference) or read through the speaker summaries.
- Atlas of Living Australia
- Victorian Biodiversity Atlas
- Citizen Science - BowerBird
- Visualising Victoria's Biodiversity
A total of 87 participants were connected across 14 locations; Ararat, Ballarat, Bendigo, Benalla, Colac, Geelong, Hamilton, Heywood, Heidelberg (Arthur Rylah Institute), Knoxfield, Nicholson Street - Melbourne, Orbost, Warrnambool and Wodonga.
List of groups/organisations in attendance;
Educational: Federation University, Bendigo TAFE.
Local Government: Moorabool Shire, Pyrenees Shire, City of Whittlesea, Cardinia Shire.
Field Naturalist Clubs: Ballarat, Bendigo, Hamilton, Geelong.
Community Conservation Groups: Ballarat Environment Network, Friends of Eastern Otways, Australian Plant Society, Pallisters Reserve, Castlemaine Landcare, Northern Bendigo Landcare, Wedderburn Conservation Management Network.
Conservation Organisations: North Central Catchment Management Authority, Goulburn Broken Catchment Management Authority, Trust for Nature, Parks Victoria, Conservation Volunteers Australia, Birdlife Australia, Museum Victoria, Vic Forests, Department of Economic Development, Jobs, Transport and Resources (Ararat), . Department of Environment, Land, Water and Planning (DEWLP) staff across 14 locations, inc. Nicholson Street, Knoxfield and Arthur Rylah Institute, Heidelberg.
Industry: Biodiversity Services, Culingaia Environmental Consultants, SFM Forest Products, Bret Lane & Associates.
Private: x 4.
Speaker summaries
Atlas of Living Australia - A state-of-the-art online information platform, Peter Brenton, CSIRO
Peter introduced the Atlas of Living Australia (ALA) as one of several facilities funded by the Australian Government through the National Collaborative Research Infrastructure Strategy (NCRIS) and is hosted by CSIRO.
A driving ideal behind the ALA was to increase capacity to share information held across the collections of institutions relevant to Australia.
The ALA provides a means of providing;
- more effective & efficient scientific research
- expanded research opportunities
- informing policy & management
- community participation & connection
- education resource
Peter said the ALA had a notion based on 'Collect it once, share it, use it many times and to make information freely available online'.
Biodiversity data & the ALA
- Share, Discover,
- Aggregation,
- Visualise
- Models and analytics
The CSIRO is heavily involved with the pre-loading activities, licence negotiations and standardisation. The enormous amount of data has resulted in the ALA being the largest and most comprehensive dataset on Australia's biodiversity. Contributors also get benefits in terms of increased exposure and access to their material.
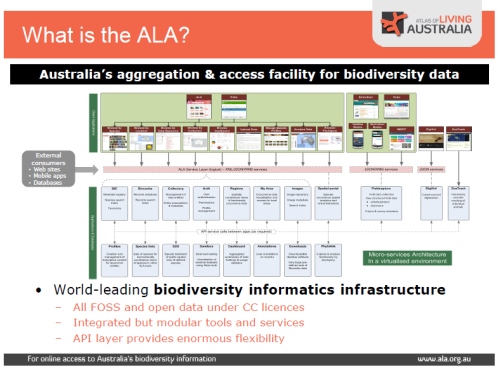
World-leading biodiversity informatics infrastructure
Peter spoke about the architecture that underpins the Atlas which is a semi modular system with a range of applications and servers which sit behind the scene bringing data and metadata from collections and other resources which interact with each other as needed. External users can interact through web sites, mobile apps and databases.
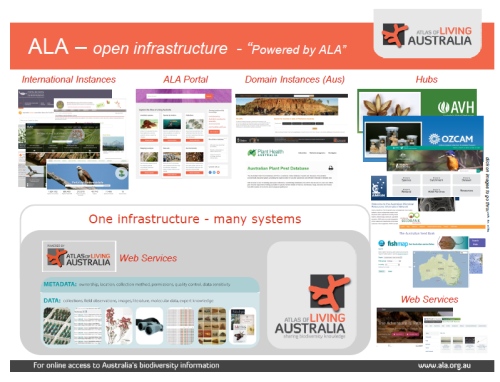
Peter spoke about the open infrastructure of ALA which includes a number of Domain portals e.g. The Atlas of Prehistoric Australia as well as thematic hubs which are filtered views of the Atlas e.g. Australia's Virtual Herbarium. The ALA also incorporates web services e.g. Monash University's Jock Marshall Reserve.
International
The ALA infrastructure has been taken up by a number of countries e.g. France, Portugal, Spain, Mexico, Puerto Rico and Scotland with the number of countries constantly growing.
Global Biodiversity Information Facility (GBIF)
The ALA is a regional node of the GBIF, contributing about 1/10th of Global biodiversity records. The GBIF is used in relation to Global scale scientific research and informing trends in:
- Biodiversity status.
- Planning for & tracking against international biodiversity management targets (Aichi, CBD, IPBES, etc.).
- Predictive modelling for trans-national biosecurity and human & animal health issues.
- Predictive modelling for biodiversity responses to climate change and other factors.
Sharing biodiversity knowledge
The ALA has had a significant investment since 2008 with approx $50 million in the Atlas infrastructure. This investment has made Australia one of the World leaders in this type of technology. At present the ALA contains 67.7 million records, 5,238 datasets, 477 spatial layers. The use has involved 9 billion records downloaded from 530,000 events. Peter pointed out the significant efficiencies of having the Atlas when considering the many hours which have been saved by users compared to lengthy searches of data before the Atlas existed.
ALA tools for biodiversity
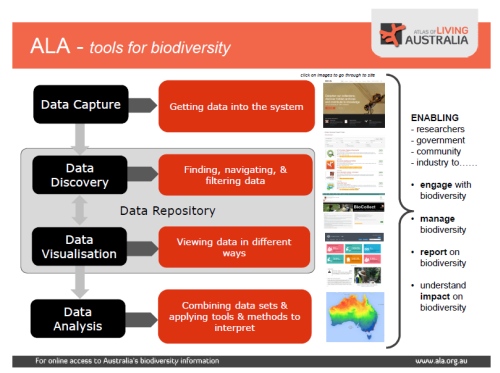
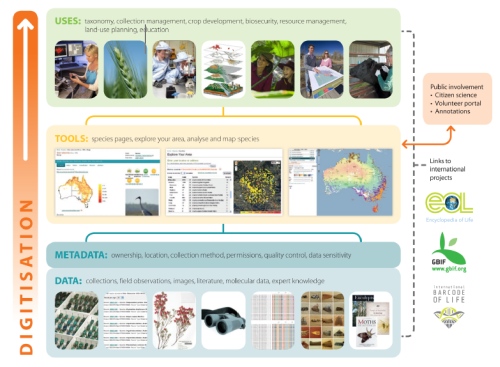
Data capture
Methods of data capture
- Direct data uploads - uploaded in various forms e.g. , spreadsheets, database files, old data format, direct web services.
- Sandbox - people can upload their own datasets.
- Sightings App. both mobile and web accessible.
- Crowd source digitisation tool - used to digitise museum and herbarium images, field note books etc. approx. 300,000 records have been added to the Atlas using this methodology.
- Bio-collect +mobile app. - used for general data capture tool.
- Merit system - used to support data capture on behalf of Federal Government, Department of Environment regarding environmental intervention data.
- Profiles tool - content authoring tool for specialised topics.
- Indigenous seasonal calendar.
Data discovery
The ALA is constantly refining ways to help people efficiently find data, particularly when there are large volumes of data to sort through. At present users can search data by;
- species
- location / region
- type of collections
- data sets
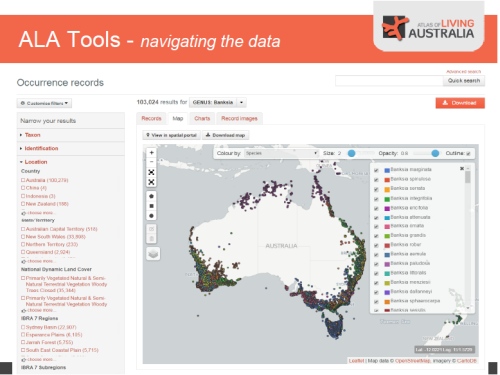
Visualisation
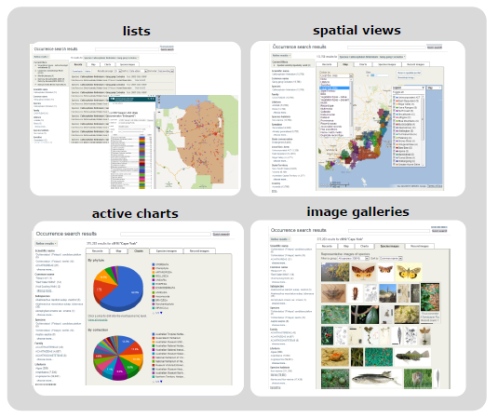
Data analysis
The spatial portal is the ALA's primary analytical tool which can be used for;
- point data over spatial layers
- environmental niche modelling
- scatter plot analysis e.g. species and climate
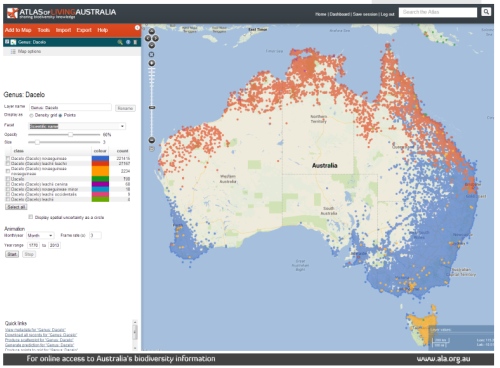
Phylolink
Phylolink is a tool used to explore biodiversity through a phylogenetic (tree of life perspective).
High performance modelling
The ALA has partnerships with direct links to Biodiversity Climate Change Virtual Laboratory (BCCVL) where selections in ALA can be used in BCCVL to undertake modelling and bring results back into ALA.
Indigenous ecological knowledge
This a new area of development for the Atlas which brings indigenous perspectives on biodiversity through seasonal calendars, stories, names etc. linking Western science with indigenous knowledge and giving a voice to indigenous perspectives on biodiversity.
See also: SWIFFT video conference notes on indigenos knowledge.
Summary
- The ALA is world-leading biodiversity informatics e-infrastructure.
- ALA provides capabilities right across the environmental information supply chain.
- ALA is strongly connected at all levels of society – local, regional, state, national and global.
- ALA is an exemplar for open infrastructure, open data and data re-use.
- ALA has significantly contributed to the volume, quality and accessibility of Australia’s biodiversity data.
- ALA is enabling new areas of research and significantly improved efficiencies in data access.
- ALA’s partnerships with NCRIS, the CSIRO and its many contributors are critical to it’s success.
- Atlas of Living Australia, Contact: Peter Brenton, CSIRO
Victorian Biodiversity Atlas - Mel Hardie, Senior biodiversity curator, Department of Environment, Land, Water & Planning, Victoria
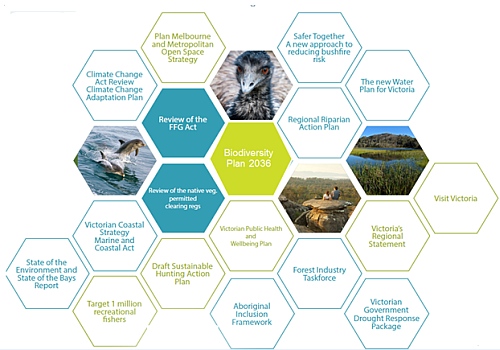
Mel spoke about the Victorian Biodiversity Atlas (VBA) in the context of providing high quality biodiversity data to support the goals of Victoria's new 20 year Biodiversity Strategy to be released in 2017. In particular the capacity to have reliable base line information regarding the current state, distribution and condition of Victoria's biodiversity.
The Victorian Biodiversity Atlas is an online curated species occurrence dataset for Victoria that covers the terrestrial, freshwater and marine environments and all native and naturalised plants and animals. A key feature of the VBA is that the dataset reports on only those records that have been verified by species experts resulting in a high standard dataset necessary to meet government standards.
Data collection
The VBA relies on the extensive, skilled and dedicated recording community;
- field naturalist groups
- consultancies
- government agencies
- statewide and national institutions e.g. Royal Botanic Gardens, Melbourne Museum.
Mel said the VBA currently contains 7.5 million curated and published records. Data is shared within Victoria and nationally via the Atlas of Living Australia.
How the data is used
Mel spoke about the extensive number of biodiversity related activities, programs strategies and reviews which rely on being able to gain access to reliable biodiversity data to understand where animals and plants live now and how that has changed over time.
VBA point data display
Mel spoke about the visualization of data. She used the example of Acacia ausfeldii listed as Vulnerable in the Victorian Advisory List.
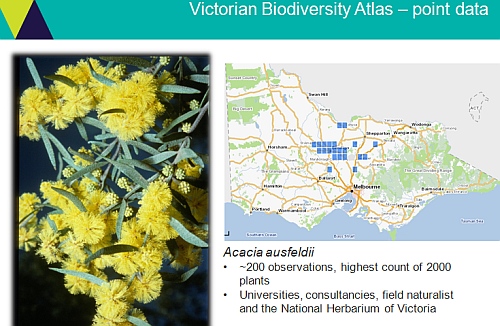
This species has records from 1770 to present with about 200 observations totalling 2,000 plants. The data has been collected through voluntary field naturalist groups and the State Herbarium, representing thousands of dollars of investment and time. The point data provides valuable information for conservation of the species but does not show the likely extent of this species range currently or even where it is likely to persist in a warming climate?
Habitat distribution models
These models look at suitable habitat for species. They provide a tool for predicting where a species might occur now or in the face of climate change. The distribution models will become a valuable tool for more informed and consistent decisions on regulation, management and investment.
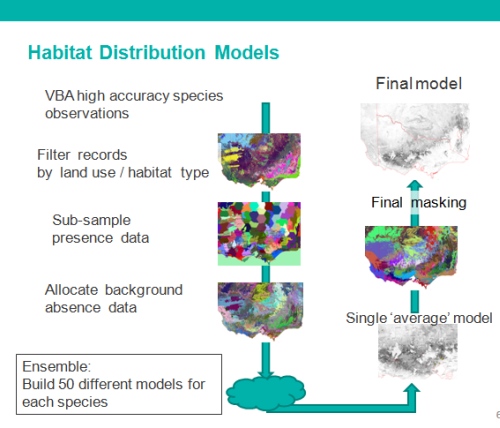
Mel said the Habitat Distribution Model process is highly complex with an intensive process to develop a model for a species. The process involves filtering out any records to attain high levels of accuracy. Old records are not used with all the records used in modelling being post 1978. Modelling involves a process of filtering using the latest LANDSAT imagery to help find different landscapes and habitat uses. The final model does not predict species occurrence but rather suitable habitat for the species, which can be the focus of further on-ground research.
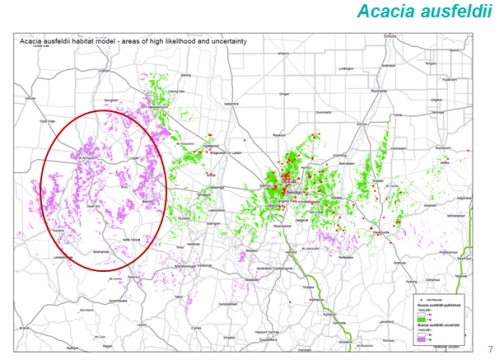
Habitat Distribution Model for Acacia ausfeldii (above). The green areas represent habitat and land use areas with current accepted records (red dots). The purple area predicts suitable habitat with low certainty of occurrence. The model provides information that can be used to increase opportunities to collect new records of Acacia ausfeldii that could significantly increase our knowledge of the distribution of this species.
Species modeling will be an important tool in helping people to undertake surveys in areas of suitable habitat with low certainty for a whole range of species.
Modelling for Long-footed Potoroo
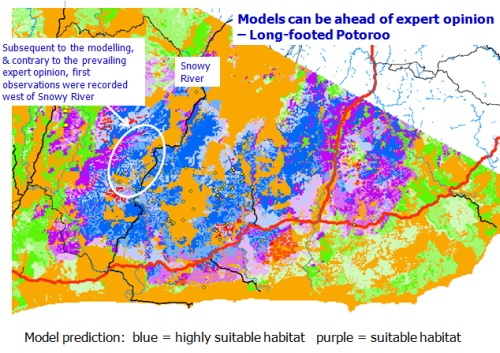
Mel showed a practical example of how modelling assisted in the detection of new records and distribution of the Long-footed Potoroo. Prior to modelling this species was only considered to exist east of the Snowy River. Habitat modelling revealed areas of highly suitable habitat to the west of the Snowy River which were targeted for surveys and Long-footed Potoroo were found, thus increasing our understanding of this species.
Data collection tools
A new development in data collection is development of a VBA mobile tool to streamline data entry. The mobile tool is still a prototype but hoped to be released later in 2017.
Work is also being done to integrate the VBA species API with Museums Victoria API which will allow greater flow of images, general description and habitat information.
The VBA will be working towards having geolocation data automatically loaded from media files or mobile's GPS.
National & International uses
Mel discussed how the VBA data to will feed into national programs such as National Environmental Science Programme, particularly the Threatened Species Recovery Hub funded by the Commonwealth.
The VBA also feeds into the Living Plant Index which measures worldwide biodiversity abundance levels based on 14,152 monitored populations of 3,706 vertebrate species. A startling picture is emerging where terrestrial vertebrates populations have experienced a 58% decline over the last 40 years.
Global decline of biodiversity 1970 - 2012
- Terrestrial populations declined by 38%
- Freshwater populations decline by 81%
- Marine populations declined by 36%
Living Plant Index report 2016 pdf
Contact: Mel Hardi, Department of Environment, Land, Water & Planning, Victoria.
Citizen Science & BowerBird - Ken Walker, Museum Victoria
Ken spoke about the critical role objective science plays in environmental decision and policy making. In general, people better appreciate what they better understand.
Involving and connecting the public in the acquisition of scientific data, the use of and analysis of scientific data will empower them to better appreciate and better engage with science and evidence based decisions. Citizen Science is an effective way to achieve this goal and BowerBird seeks to connect Citizen Scientists with the expert professional scientists.
Ken spoke about the fact that Museums have shrinking funds and staff with the number of curators being significantly reduced. Museums are very rich in historical data but are unable to maintain the levels required to provide recent collecting data. Programs such as Bioscans, BushBlitzs and Citizen Science are filling the collecting gaps. Ken spoke about the quality of museum records which often have actual specimens with good spatial and temporal data but these tend to be older records.
Ken said natural history museums contain immense scientific and cultural collections. There are an estimated 67 million specimens in Australian Natural History Collections; about 10 million registered records on Atlas of Living Australia (ALA) although many species do not have data or images.
Museums Victoria has over 801,000 records but less than 22,000 images on ALA. The BowerBird Citizen Science website (primarily funded by ALA) commenced in 2013 now has almost 50,000 images and records on ALA.
Example of Citizen Science in action
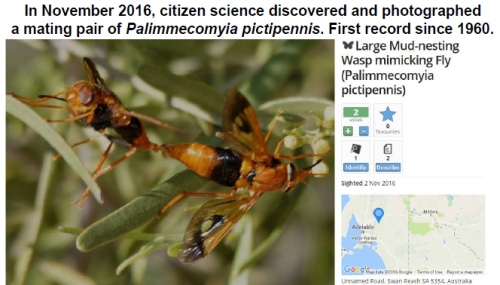
Ken used the example of a type of wasp mimicking fly Palimmecomyia pictipennis described in 1860 with its location being somewhere in South Australia. The species was listed on ALA but with no data or images. In November 2016 a Citizen Science person photographed a mating pair of the species with location recorded. The record was validated by an expert at CSIRO. It was the first time this species had been photographed and now there is an exact location on the map.
Development of Citizen Science
The term Citizen Science was first defined by the Oxford Dictionary in 2014 “The collection and analysis of data relating to the natural world by members of the general public.” In reality Citizen Science has been operating for many years. Ken used the example of the American Christmas Bird Count, which began in 1900 and still operating with 65 to 70 million birds counted each year.
The uptake of Citizen Science has been boosted by new technologies such as digital cameras and the internet.
In 2012 the Global Biodiversity Information Facility (GBIF) conference gave high prominence to Citizen Science through recognising the role Citizen Science can play in biodiversity conservation.
In November 2016 the Federal Government provided a $4 million boost to Citizen Science through grants to research related projects.
Types of Citizen Science
Ken spoke about the many definitions of Citizen Science and felt it is essentially about the general public engaging with and sharing science. He also spoke about the different types of Citizen Science interactions.
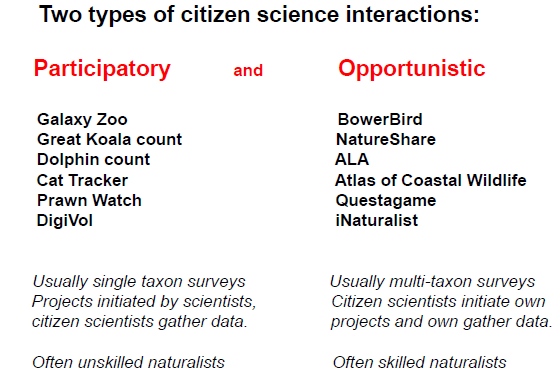
Participatory Citizen Science
Ken spoke about the Great Koala count as an example. The count is organised by scientists and held every November for 10 days across Australia. Anyone can join in by logging in using a phone App. They walk around looking for a Koala, for every 15 minutes there are no sightings an absence is recorded. When a Koala is spotted they select 'find me' and the system automatically records the location and uploads it to ALA.
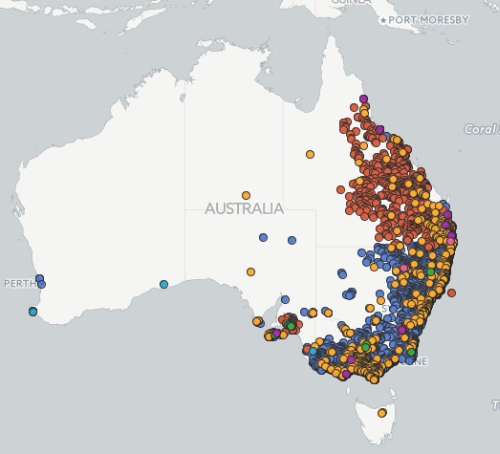
Opportunistic Citizen Science
This type of Citizen Science revolves around member not scientist initiated projects. As an example Ken spoke about the Insects & Inverts project on BowerBird which has 432 members who have contributed 28,055 records. BowerBird currently has around 500 projects relating to species and locations all initiated by Citizen Scientists. An important feature of BowerBird is that any record must include an image which is helpful for peer review.
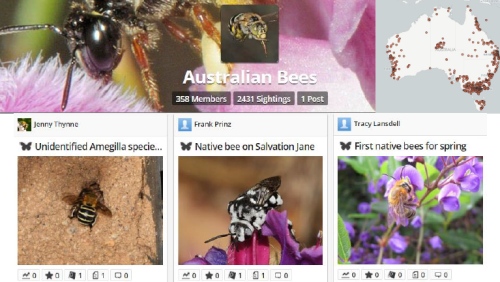
Ken spoke about a project he put up on Australian Bees. The project now has 358 members who have contributed 2431 sightings. People can put up images of unidentified bees which can be identified by project members.
Benefits of BowerBird
Biosecurity
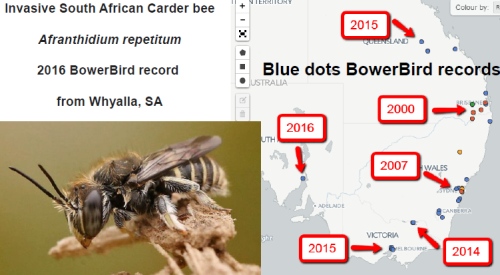
Ken used an example of the invasive South African Carder bee Afranthidium repetitum which was introduced into Australia from South Africa. It was first recorded in Brisbane around the year 2000 and Sydney in 2007 both being Museum records. BowerBird has added many new records from South Australia, Victoria, New South Wales and Queensland.
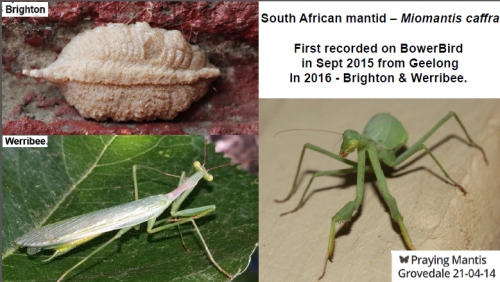
Another example from BowerBird was the image of a Praying Mantis taken at Grovedale near Geelong and identified via BowerBird as being the first record of the invasive South African Mantid Miomantis caffra. This species was recorded in New Zealand in 1978 but not known from Australia until this record on BowerBird.
Biodiversity
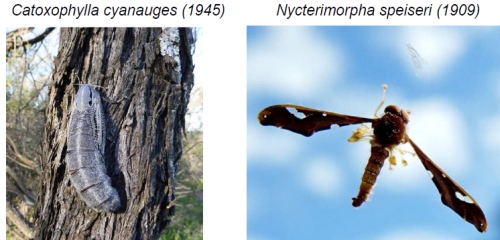
Ken spoke about the power of Citizen Science in identifying native species which have not been recorded for many years. He used the example of two species of moth which had not been seen for many years, but through incidental findings and records being placed on BowerBird these species were rediscovered complete with location and images.
Ken sometimes finds interesting images placed on Facebook feeds where he can assist with accurate species identification. He spoke about the discovery of a pollen wasp Vespidae masarinae in Queensland which is a native species rarely known or photographed. Without Citizen Science this significant record would have otherwise been mistaken for a European Wasp.
Research
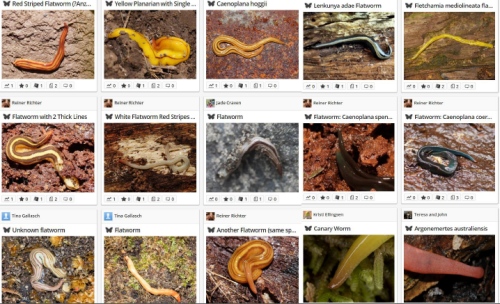
Ken used the example of a Flatworm project that was set up to help people identify flatworms on BowerBird. The project now has over 100 people contributing flatworm data to science, many records being new to science and added to ALA.
Behaviour
Citizen Science has a great capacity to improve our understanding of species behaviour through having a vast number of people watching and recording what they see.
Ken used the example of observations relating to a Leaf-cutter Bee (Megachile). This species of bee was thought to build their leafy brood cells underground in disused burrows. But observations compiled over 3 days and placed on BowerBird have shown the Leaf-cutter Bee can use underground burrows created and co-occupied by Wolf spiders. Ken was so amazed at the find he sent images to bee experts all around the world and Australian experts on spiders and no one had ever seen this behaviour before.
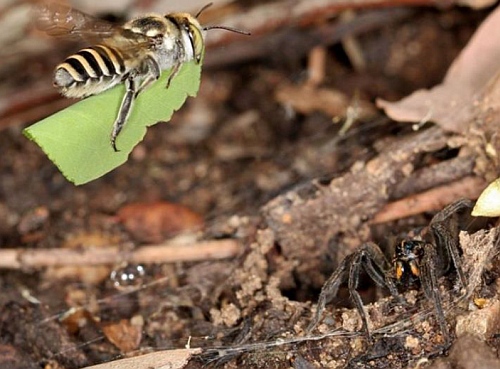
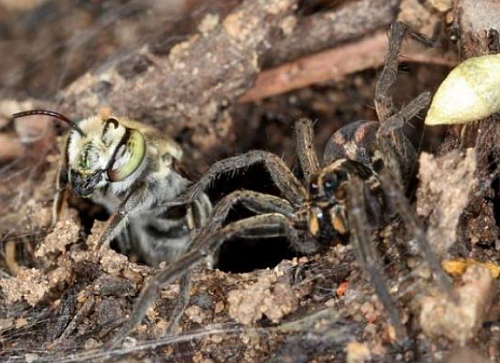
Citizen Science is now a Worldwide data collection and analysis tool. Please engage with it.
Visualising Victoria's Biodiversity & SWIFFT - Rob Milne, Centre for eResearch & Digital Innovation (CeRDI), Federation University - Australia
Rob provided an overview and update on Visualising Victoria's Biodiversity (VVB) using live online demonstrations. The VVB is a partner site to SWIFFT and focuses on presenting data in a spatial context. The VVB is a portal where a whole range of resources can be assembled together and build tools so people can use, visualise and explore data for decisions, conservation planning or discovering more about the environment.
Rob said the sharing of data has become much easier and more effective through digital and web services. The research group at Federation University has been developing spatial data services for a range of applications, e.g. ground water, geology, earth sciences, agricultural research etc. The VVB is another use of the technologies being developed.
Background layers & categories
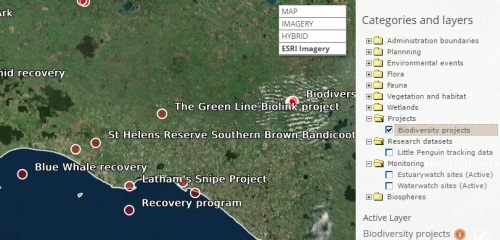
Rob spoke about the background layers which includes Worldwide ESRI imagery and Victorian High Resolution Air photography Imagery which are both updated as new imagery becomes available.
The Categories and Layers include a large number of layers which can be tailored for use. Many of the layers are fed into the VVB as live services updated from the various servers. Rob pointed out that all the data displayed on VVB is attributed so people can click on the layer for more details of the metadata and where the data came from.
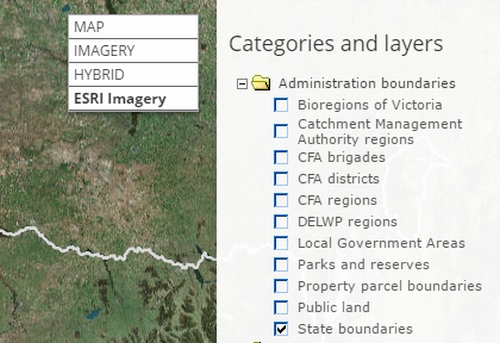
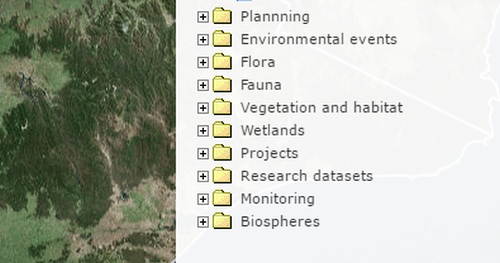
The VVB includes a range of biodiversity information layers for planning and discovery.
Sharing data at a local level
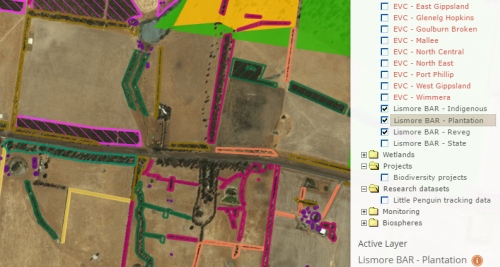
Rob spoke about opportunities to share local content, particularly from local data sets where surveys and mapping are carried out through local groups and organisations. The information can be displayed as a single layer or by combining multiple layers from the selection provided. This is a very powerful way of visualising data to assist in planning, management and discovery of biodiversity data.
Specific research data
The VVB provides opportunities for research results to be shared visually. Rob used the example of the Little Penguin research tracking data made available through the Oztrack system. The new versions of Estuary Watch and Water Watch also include data which can be viewed on VVB.
More about OzTrack which is now part of ALA renamed Zoatrack.
Reporting tool
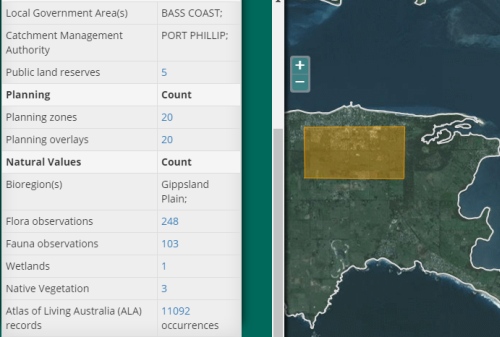
Rob demonstrated the use of the reporting tool to assist people in understanding what information is applicable to their local area or property. People can select the Report Tool which allows them to draw in an area of interest and gain a full report packaged up from the various layers in the VVB and presented in a way that can be easily viewed and further explored.
Biodiversity projects
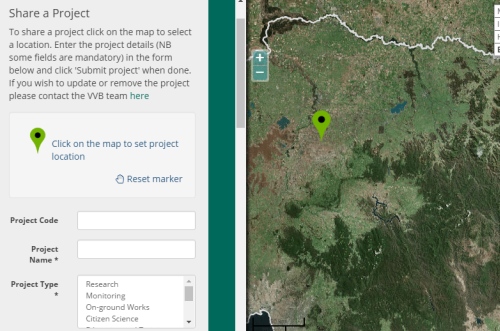
The VVB is closely linked with SWIFFT in sharing information regarding biodiversity projects across Victoria. Users can explore projects and select a range of links to reveal more detailed information on specific projects and species.
SWIFFT updates
A new search function has been added to SWIFFT. Lists of threatened flora and fauna have been added for most Government Areas. Rob also provided an overview of the menus and other information contained in SWIFFT. People are encouraged to add content by contacting SWIFFT.
The term API (Application Program Interface) is a tool which allows different systems to talk with each other sharing data files.
KEY POINTS SUMMARY
| The Atlas of Living Australia (ALA) is World-leading biodiversity informatics e- infrastructure with 67.7 million records, 5,238 datasets, 477 spatial layers. |
| ALA use has involved 9 billion records downloaded from 530,000 events. |
| The Victorian Biodiversity Atlas (VBA) currently contains 7.5 million curated and published records. Data is shared within Victoria and nationally via the Atlas of Living Australia. |
| VBA habitat distribution models will provide a tool for predicting where a species might occur now or in the face of climate change. |
| A new mobile App to streamline data entry into the VBA is being developed and hopefully implemented towards the end of 2017. |
| The Living Plant Index recorded a Global decline of biodiversity between 1970 - 2012. Terrestrial populations declined by 38%, Freshwater populations declined by 81%, Marine populations declined by 36%. |
| Citizen Science has a great capacity to improve our understanding of species behaviour through having a vast number of people watching and recording what they see. |
| BowerBird a is highly successful example of Citizen Science, with 432 members who have contributed 28,055 records and 50,000 images. |
| Visualising Victoria's Biodiversity (VVB) provides online spatial data which allows users to use, visualise and explore data for decisions, conservation planning or discovering more about the environment. |


